Contour Interpretation
The most useful feature on the map for navigating in the mountains is the contour line. Contour features can nearly always be identified on the ground even when covered in snow. Streams and tracks are useful too but they tend to be less reliable.
A contour line is a line on the map joining points of equal height. The Vertical Interval is the height between each contour ‐ this will be shown on the map. The Ordnance Survey 1:50,000 and 1:25,000 maps have a 10 metre vertical interval while the Harvey Superwalker 1:25,000 scale maps have a 15 metre vertical interval. Some popular maps of the French Alps have a 10 metre vertical interval which changes to 20 metres when you cross over the border into Switzerland!
So what is a contour feature? It's pretty simple really - there is a finite number of types of contour feature:-
- ring contours - which portray knolls and hills (RC)
- cols or saddles or bealachs (S)
- gentle slopes (GS)
- medium slopes (MS)
- steep slopes (SS)
- valleys or glens or re-entrants - they come in different shapes and sizes (V)
- ridges - which can be small, medium or large (R)
- flat areas - the absence of contours can be useful (F)
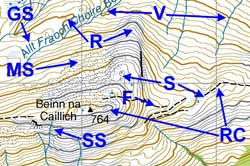
The illustration map shows examples of all these features (the letters in brackets shown above refer to the features indicated on the map).
Contour interpretation is about relating the contour features on the map to the real features on the ground (and vice versa). This can be done in three main ways:-
- By evaluating the ground under your feet, defining what type of feature it forms and then identifying it on the map. This can be done in both good and poor visibility.
- In good visibility; by looking at features beyond your immediate location and identifying them on the map. These features may be close by or be several hundreds of metres away. Remember to set your map - see "Setting the Map".
- In poor visibility; by examining the contour features on the map and then forming a mental picture of what the ground ahead of you would look like if the visibility was good. This ability to anticipate what the ground is going to be like before you get there is not only very useful - it's good fun too.
Like all skills, the more you practice the better you become. On days with good visibility there may be a tendency to walk along looking at the view or chatting, rather than studying the map in detail. A habit worth acquiring is to always spend part of each hill day developing your contour interpretation skills - even if it's not really necessary at the time. You could set a limit on the time you will spend on this - maybe half an hour or until you reach a particular landmark.
Build up a repertoire of images by matching up features on the ground with the contours on the map. For example, the illustration map shows two examples of a ridge (R). The westerly ridge is fairly narrow but is relatively easy angled (although there may be a short steep section at the apex of the thick contour) whereas the easterly ridge is broader and steeper. By identifying these features on the ground you will be able to store their images away for use in other situations where the terrain is similar.
Another example of variations between the same type of feature can be found by examining slopes. How close together are the contours on a steep or medium slope? How do you define a steep or medium slope? 45 degrees is steep - generally too steep for walking whereas 27 degrees is a reasonable angle - we could call this a medium slope.
How do we know if the contours on the map are going uphill or downhill? Here's a few ways:-
- Look for the contour heights which are incorporated within the contour lines. Also remember that the contour height figures are printed on the map facing uphill i.e. if you are looking at the figures the right way up you are looking uphill (on the map) and if they are upside down you are looking downhill (on the map).
- Rivers and streams flow downhill and so they are useful indicators of high and low ground on the map.
- Another useful way of checking whether a slope on the map is going up or down is to find the nearest hill (on the map!). This will usually make it clear.
By developing your mental images of different features and how they are represented on the map by contours you will increase you ability to work out where you are and to anticipate the ground which lies further ahead in your journey. Contour interpretation is fun - in both good and poor visibility.
This page reproduced with the kind permission of the Mountaineering Council of Scotland (MCofS). They run a number of Mountain safety courses, Seminars and Lectures. You can join the MCofS here